From Data Chaos to Financial Clarity
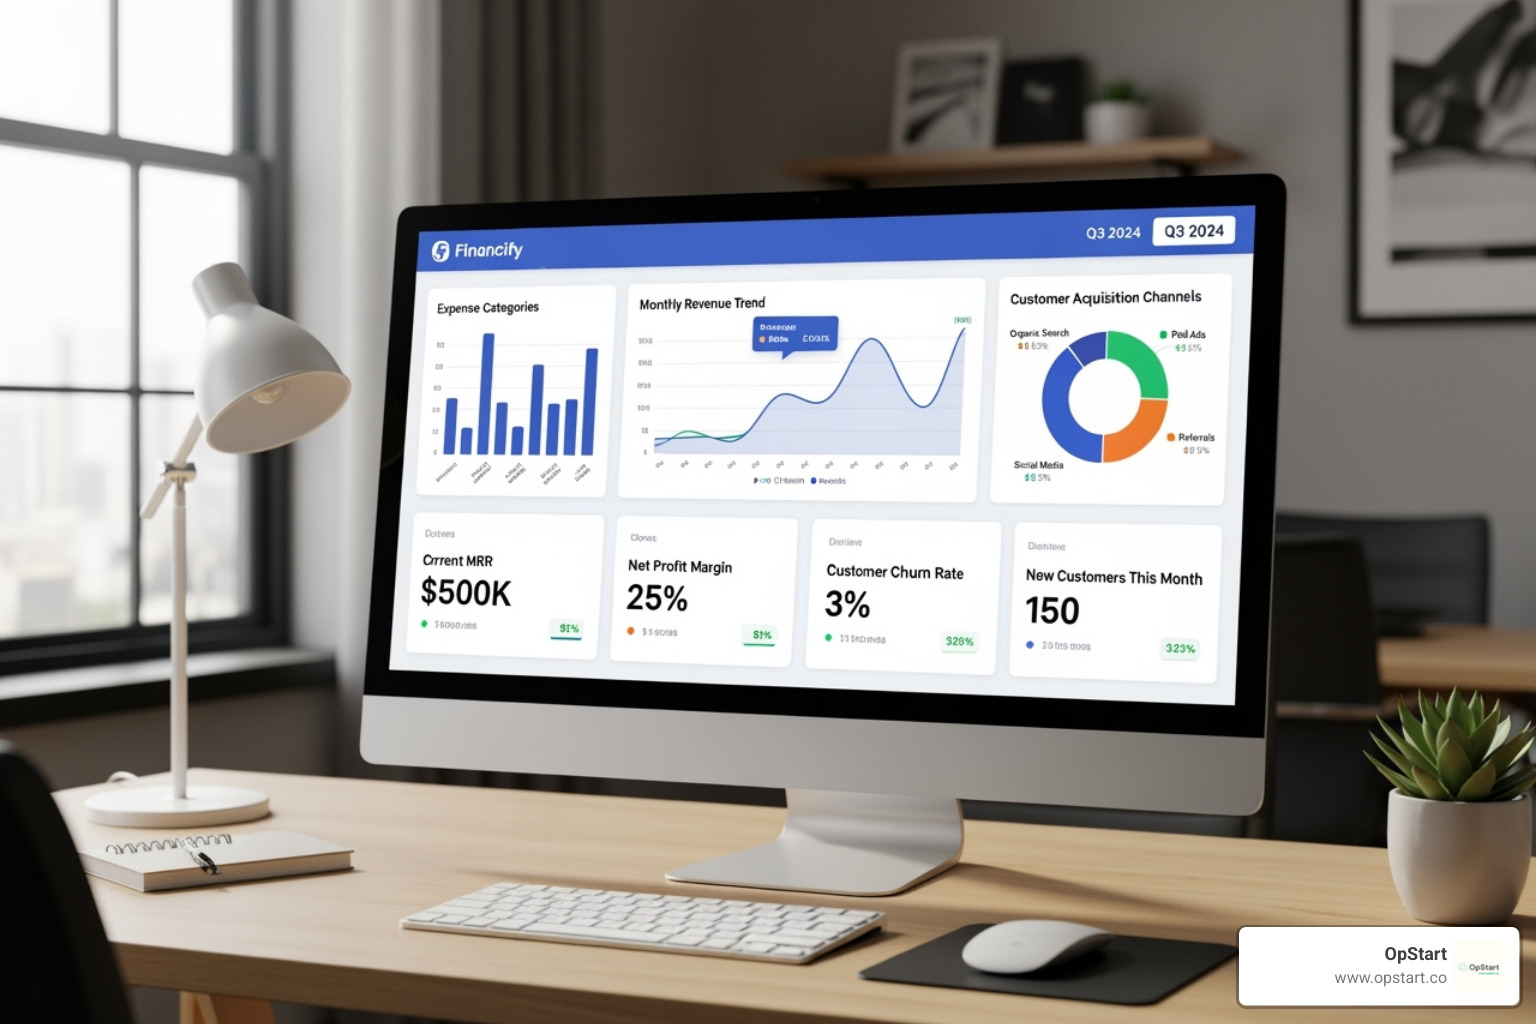
A startup financial dashboard consolidates your most critical financial metrics-like cash runway, burn rate, and revenue-into a single, visual interface. It updates in real-time to help you make faster, smarter decisions.
Key benefits of a startup financial dashboard:
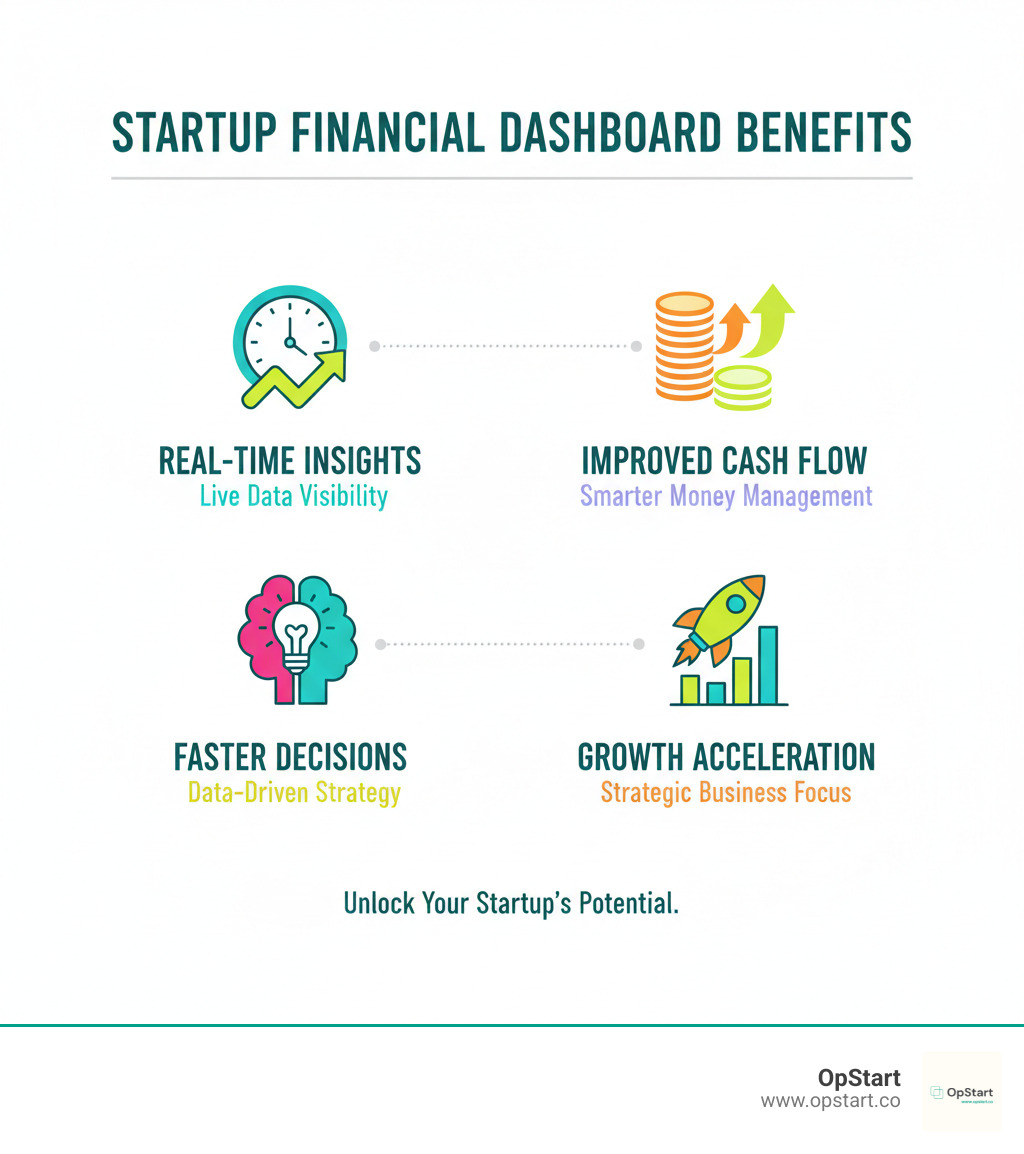
- Real-time visibility: See your current cash position, runway, and burn rate at a glance
- Faster decisions: Spot trends and risks without digging through spreadsheets
- Investor confidence: Share professional, data-backed reports instantly
- Strategic focus: Spend less time compiling data and more time growing your business
The numbers are sobering: 90% of startups fail, often because founders overlook critical data. Yet startups that actively monitor their metrics grow 20% faster than those that don’t. The difference is a clear view of the company’s finances.
One CEO spent hours every month manually compiling data from QuickBooks, Stripe, and spreadsheets. This led to confusion among leadership and investors. After implementing a dashboard, they could proactively publish financial updates, streamlining communication and providing a clear pulse on the business.
Financial dashboards transform how you run your startup, turning scattered data into actionable intelligence. Companies using them are twice as likely to improve decision-making and see a 24% boost in revenue growth-exactly what you need when every decision counts.
I’m Maurina Venturelli, and I’ve helped build the marketing engines behind companies like Sumo Logic (leading to IPO) and LiveAction. Now at OpStart, I help startups master their finances through better data and smarter startup financial dashboard strategies, where we deliver the full finance function as a service.

Find more about startup financial dashboard:
Why a Financial Dashboard is Your Startup’s Command Center
Think of your startup financial dashboard as a cockpit’s control panel. It provides the essential, real-time visibility needed to steer your business and make smart decisions when every choice matters.
Data shows that companies embracing data-driven decision-making are 23 times more likely to acquire customers, 6 times more likely to retain them, and 19 times more likely to be profitable. These aren’t just statistics-they represent the difference between startups that thrive and those that struggle. Regularly reviewing your financial metrics makes you 30% more likely to grow successfully.
A well-designed dashboard provides data-driven growth by revealing what drives revenue and costs. You get real-time visibility into your financial health, so you’re no longer waiting for month-end reports to find a cash shortage. The dashboard acts as an early warning system for risk identification, flagging anomalies like a spike in customer acquisition costs. It also helps with opportunity spotting by highlighting trends so you can double down on what works.
For investor reporting, a clean, dynamic dashboard demonstrates professionalism and builds trust. It makes fundraising conversations smoother. For more context, explore our guide on Startup Financial Planning and learn What is the Role of Finance in a Business?.

Core Financial Health Metrics
These are your startup’s vital signs, telling you if the business is healthy and how long it can operate.
Cash on Hand is your current bank balance-the fuel in your tank. Knowing this in real-time prevents surprises.
Burn Rate measures how fast you’re spending cash, usually expressed as a monthly figure. Understanding it is crucial, as running out of money is a primary cause of startup failure.
Runway is your most critical calculation. It’s the number of months you can operate before cash runs out. If you have $100,000 and burn $10,000 per month, you have 10 months of runway.
To master these, dive into What is Cashflow? and how to conduct a Cash Flow Analysis.
Growth and Profitability Metrics
Once you’re confident about your cash position, focus on sustainable growth.
For subscription businesses, Monthly Recurring Revenue (MRR) is the predictable revenue you expect each month. Slack famously boosted its MRR by 110% through workflow optimization. Annual Recurring Revenue (ARR) is simply MRR multiplied by 12, giving a longer-term perspective.
Gross Margin shows the profit from each sale after direct costs. A healthy gross margin is essential. Operating Margin goes further, showing profit after all operating expenses (salaries, rent, marketing). It provides the clearest picture of your core business efficiency.
Our guide on How to Read a PL breaks these metrics down in plain language.
Customer Economics Metrics
These metrics help you understand the economics of acquiring and keeping customers.
Customer Acquisition Cost (CAC) is what you spend to land each new customer. Casper, the mattress company, slashed its CAC from $1,200 to $300 by using influencer marketing, helping propel them to a $1.1 billion valuation.
Customer Lifetime Value (LTV) projects the total revenue you can expect from a customer. Netflix, a master of retention, achieved an impressive $450 LTV in 2023.
The LTV:CAC Ratio reveals if your growth is sustainable. You want LTV to be significantly higher than CAC, ideally 3:1 or more. If not, your business model has a serious problem.
Churn Rate is the percentage of customers who cancel their service in a given period. High churn undermines growth. Spotify reduced its churn from 7% to 4.5% by investing in podcasts, showing how product strategy can improve retention.
Choosing Metrics by Startup Stage
Your startup financial dashboard should adapt as your company grows. What you track must evolve.
Here’s how to think about metrics at different stages:
| Stage of Growth | Key Metrics to Focus On | Why They Matter |
|---|---|---|
| Pre-Seed/Seed Stage | Runway, Burn Rate, Cash on Hand | Survival is everything. You need to know how long you can operate before needing more funding. Track every dollar to ensure you have enough runway to reach your next milestone. |
| Growth Stage | CAC, LTV, MRR Growth, LTV:CAC Ratio | Now it’s about proving your business model scales. Can you acquire customers profitably? These metrics show investors you have product-market fit and can scale efficiently. |
| Late Stage | Profitability Metrics, Operating Leverage, Operating Margin, Gross Margin | Investors want to see a path to profitability. Can you grow revenue faster than expenses? These metrics demonstrate you’re building a sustainable, long-term business. |
Your dashboard isn’t static-it should evolve with your business.
How to Build an Effective Startup Financial Dashboard in 5 Steps
Building an effective startup financial dashboard is about asking the right questions, connecting your data, and designing something people will use. Think of it like building your first product: start with a clear problem, test, and iterate. You likely already have what you need in your accounting software, payment processor, and CRM.
Step 1: Define Your Goals and Audience
Before you start, ask: What decisions will this dashboard help us make? Don’t start with “what data do we have?” but with “what choices do we need to improve?”
Write down three to five specific questions your dashboard must answer. Then, consider the audience. Your co-founder needs daily operational data. Your board wants a strategic view. Investors care about disciplined spending and key metrics for your stage. A dashboard for founders looks different from one for your board, and that’s how it should be.
Use the five-second rule: if someone can’t grasp the main message in five seconds, your dashboard isn’t working.
If you’re preparing for investors, our Investor Readiness Checklist can help you frame your financial story.
Step 2: Gather Your Data and Choose Your Tools
This step is detective work: finding where your financial data lives. Most startups have numbers scattered across tools like accounting software like QuickBooks or Xero, payment processors like Stripe, CRMs like HubSpot, and payroll systems like Gusto.
List every system that touches money. Note what data it holds and how often it updates. Your accounting software has your P&L, Stripe has revenue details, and your CRM tracks customer costs. The goal is to create a single source of truth. When these streams flow into one place, you stop reconciling numbers and start making decisions.
This is where many founders need help, and we regularly assist startups to connect their accounting software and other systems. Modern tools talk to each other through APIs, so you don’t need to be a developer to connect them.
Step 3: Design Your Dashboard for Clarity and Impact
The human brain processes images 60,000 times faster than text, which is why a well-designed startup financial dashboard is so effective. Good design isn’t about aesthetics; it’s about making data instantly understandable.
Start with simplicity. Pick five to seven critical metrics and put them front and center. Arrange your metrics in an inverted pyramid, with the most important numbers (like cash and runway) at the top. Group related metrics to tell a coherent story.
Use color wisely. Green means good, red means pay attention. Stick to that convention. Choose the right chart for each metric: line charts for trends, bar charts for comparisons, and simple numbers for KPIs like runway.
The best dashboards don’t just display data-they tell a story about where your business is heading.

Step 4: Build, Test, and Automate
Now, build your startup financial dashboard. Assemble your visualizations and double-check all formulas and connections. A dashboard with wrong numbers is worse than no dashboard at all.
Share early versions with your team for honest feedback. Does it answer the questions you identified in Step 1? Testing with real users prevents you from building something that looks good but doesn’t work.
Automation is your superpower. Manual data entry is slow and error-prone. Set up automatic updates so your dashboard refreshes itself. This gives you real-time insights without lifting a finger. The benefits are huge: less time on routine tasks, fewer errors, and faster decisions based on current data.
Our Startup Budget Google Sheets Guide offers a practical foundation before you move to more sophisticated tools.
Step 5: Establish a Review Cadence and Refine
A startup financial dashboard is a living tool. Establish a rhythm for reviewing and refining it.
Set up regular review sessions. Founders might check key metrics daily, leadership teams weekly, and board members monthly. Businesses that regularly review their financial metrics are 30% more likely to grow-you can’t improve what you don’t measure.
Assign someone to verify data quality monthly. This ensures you’re making decisions on solid ground. Most importantly, let your dashboard evolve. The metrics that matter at pre-seed are different from those at Series A. Be ruthless about removing metrics that no longer drive decisions and adding new ones that do.
Our article on Fractional CFO vs. Bookkeeper vs. CPA: What’s the Difference? can help you establish clear accountability.
Advanced Strategies: Forecasting, AI, and Customization
Your startup financial dashboard can show you where you’re going, not just where you’ve been. By using forecasting, AI, and customization, you can transform your dashboard from a rearview mirror into a windshield, making it a truly strategic asset.
Wouldn’t you love to know what happens to your runway if you hire three more engineers? Or how a 10% price increase would affect profitability? That’s the power of advanced dashboard strategies.

Integrating Scenario Planning and Forecasting
Scenario planning lets you ask “what if?” to get reliable answers before committing resources. What-if analysis turns your dashboard into a simulation tool for modeling questions like, “What if our sales double next quarter?” or “What if churn increases by 5%?” This helps you build contingency plans and make confident decisions in uncertain times.
Hiring plans deserve special attention, as headcount is typically your biggest expense. Your dashboard can show how adding new engineers impacts your runway and burn rate. We can help you model your headcount with OpStart’s tools to ensure your growth is sustainable.
Forecasting also lets you simulate how market changes like a pricing adjustment or a new competitor would affect profitability, essentially stress-testing your business model.
Start building future scenarios with our Startup Budget Template to lay the groundwork for sophisticated forecasting.
Leveraging AI for Smarter Financial Insights
The future of financial management is intelligent. AI-powered platforms are revolutionizing how startups get insights from their data.
Anomaly detection acts as a financial watchdog, instantly flagging unusual spending or revenue dips that a human might miss. It continuously monitors your data and alerts you to anything that looks off.
Predictive forecasting uses AI to analyze historical data, identify patterns, and make sophisticated predictions about future revenue, expenses, and cash flow. It’s more accurate than gut feelings or simple extrapolations.
Automated error reduction is another key AI benefit. By identifying data discrepancies, AI leads to more reliable dashboards. AI-powered platforms help startups achieve 60% faster monthly closes, a 40% drop in accounting errors, and 50% less time spent on routine financial tasks.
The adoption curve tells the story: the global AI accounting market is projected to hit $29.3 billion by 2030. Nearly three-quarters of companies already use AI in financial reporting. This isn’t a trend to ignore. Learn more about AI adoption trends in finance to see how this technology is reshaping startup finance.
Customizing Dashboards for Different Stakeholders
Different audiences need different information, so a one-size-fits-all startup financial dashboard rarely works well.
Founder dashboards are daily command centers. They need real-time cash, burn rate, runway, and daily sales for tactical decisions.
Investor dashboards tell a story of growth and potential. They focus on MRR/ARR growth, LTV:CAC ratio, and churn. They answer the question: “Is this company scaling efficiently?” This is critical when fundraising in today’s market.
Board dashboards are for the strategic, big-picture view. They cover high-level revenue trends, profitability, and market position to facilitate strategic discussions.
The key is to be selective with your metrics and keep dashboards clean. Creating multiple, custom dashboards for each audience pays off in clearer communication and stronger stakeholder relationships.
Frequently Asked Questions about Startup Financial Dashboards
What key financial metrics should an early-stage startup track?
Early-stage startups should focus on survival metrics. Your startup financial dashboard must track the essentials that determine if you’ll be in business next quarter, not complex growth ratios. The three most important metrics are Burn Rate (how fast you’re spending cash), Cash Runway (how many months you can operate), and early engagement signals like Monthly Active Users (MAUs). These provide a clear, honest view of your financial health and how much time you have to reach your next milestone.
How can startups avoid common pitfalls when creating a dashboard?
There are three common and avoidable traps. The biggest is information overload. Don’t track everything. Choose 5-7 core KPIs that matter for your current goals. A cluttered dashboard is a useless dashboard.
Next is poor data quality. Your dashboard is only as good as its data. Automate inputs from a single source of truth, like your accounting software, to eliminate manual errors and ensure your numbers are trustworthy.
Finally, keep the design simple. Use clear labels, consistent color coding (green for good, red for bad), and the right charts. The goal is for anyone to grasp the key insights in seconds.
How do financial dashboards help with fundraising?
A well-built startup financial dashboard is a superpower during fundraising. It helps you answer investor questions about burn rate, runway, and CAC with professional, accurate data, demonstrating that you’re on top of your numbers.
A dashboard also demonstrates financial discipline. When investors see you’re tracking the right metrics and making data-driven decisions, it speaks volumes about your leadership. It shows you can accurately project future performance, which builds trust and credibility.
Practically, you can generate consistent reports for investor updates without spending hours in spreadsheets. You can show clear trends and walk through forecasts with data to back you up. In today’s cautious market, a clean financial story presented through a dashboard can be the difference between getting funded and getting passed over.
Conclusion: Your Blueprint for Data-Driven Success
You now have a guide to building a startup financial dashboard. You understand that knowing what’s happening with the money is often the difference between startups that thrive and those that struggle.
Think back to the CEO drowning in spreadsheets. That doesn’t have to be you. With the right dashboard, you shift from reactive to proactive. You spot problems immediately, not weeks later. You have answers to investor questions before they’re even asked.
Financial clarity isn’t just about avoiding disaster-it’s about strategic growth. When you can see which marketing channels deliver the best CAC and understand your unit economics, you make better, faster decisions that create a competitive advantage.
But building and maintaining a world-class financial operation takes time and expertise most founders don’t have. You started your company to solve a problem, not to become an accounting expert. That’s where we come in.
At OpStart, our mission is simple: startups should have access to the same level of financial sophistication as larger companies, without the overhead. We provide the full finance function as a service-from accounting and tax to CFO-level strategic support and building effective startup financial dashboards. All at a flat rate, integrated with your preferred software.
A well-crafted dashboard is a strategic asset that empowers you to steer your startup with confidence. It’s the difference between guessing and knowing, reacting and leading.
Let us help you manage your financial operations so you can focus on what you do best: building something remarkable. Learn more about our CFO Services for Startups and find out how we can be your partner in achieving data-driven success.


